Friday, 4 December 2015

Technical Stocks To Watch on 4/12/2015 – EFFICEN (0064), COMFORT (2127), ECOWLD (8206), SUPERLN (7235), KAWAN (7216) & YEELEE (5584)

Yesterday on 3/12/2015, EFFICEN (0064) closed higher with improved traded volume and Bollinger Band opened wider during the session ended.
EFFICEN Daily Chart

EFFICEN closed below the resistance level of MYR0.290 @ MYR0.285 during the market ended. However, it started the trading session with open price @ MYR0.265 which is also a level in which the 200-days Moving Average situated on 3/12/2015.

Should the resistance level of MYR0.290 being violated by EFFICEN in the coming trading days, the next and subsequent resistance to be met are MYR0.305 and MYR0.350, respectively.

Suggest to put a stop loss @ any price below MYR0.255 should any reversal of trend happened after entering.


COMFORT (2127) able to closed well above the short term downtrend line with higher than average traded volume during the session ended on 3/12/2015.  
                                                                                   COMFORT Daily Chart

Foresee COMFORT would trade higher with the next and subsequent target prices are MYR0.765, MYR0.790 & MYR0.820, respectively in the next coming trading days.

Recommend to put a cut loss at any price below MYR0.710 should a lower high is formed after entering.  


ECOWLD (0105) successfully broke out the ascending triangle resistance of MYR1.44 on 2/12/2015 with increased in traded volume and the uptrend continue in the next trading day with Bollinger Band opened wider on both days.  
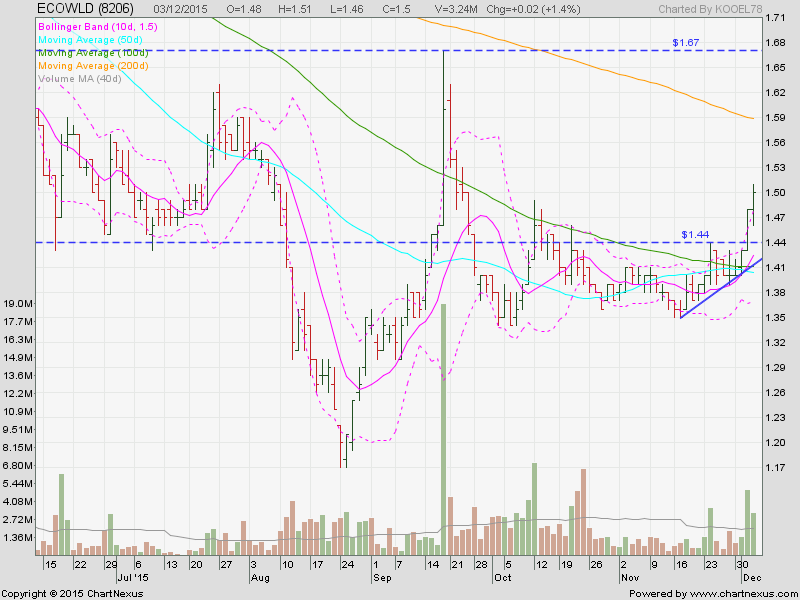
                                                                                     ECOWLD Daily Chart

Foresee ECOWLD would continue its uptrend direction with the target price is @ MYR1.67.

One should set a stop loss at any price below the ascending triangle should it really violated.


SUPERLN (7235) was well supported by MYR2.11 after the retracement from new high of MYR2.32 and closed higher @ MYR2.20 and above 10-days Moving Average during the session ended.
                                                                                      SUPERLN Daily Chart

Should the subsequent downtrend line be violated, the next target to be set is @ MYR2.32 and if this new high level also be violated, the sky is the limit for SUPERLN.

Recommend to put a stop loss any price below MYR2.05.


KAWAN (7216) tested the new high of MYR2.98 on 3/12/2015 with higher than average traded volume but failed to break the record high and closed below that level @ MYR2.96 during the session ended.
                                                                                  KAWAN Daily Chart

Look out for the price action and trading volume in the coming trading days for KAWAN to determine the new high level of MYR2.98 could be violated.

Recommend to put a stop loss at any price below MYR2.80 should any uncertainty happen.


YEELEE (5584) tested the recent resistance level and closed at the same level @ MYR2.02 during the session ended on 3/12/2015.  
                                                                                  YEELEE Daily Chart

In case this level is violated, the next price level for YEELEE to target at is the new high of MYR2.25.

For those who intend to enter into YEELEE, a stop loss could be put @ any price below the support level of MYR1.93.


Good luck & Happy Trading!


Disclaimer:

All posts and documents submitted in this blog are solely for open discussion and education purposes only. All recommendations and opinion provided are solely for your consideration only and you should exercise your own judgment in forming your own investment decision(s). Please also be informed that equity investment is risky and we recommend you to conduct sufficient searches for information in addition to referring our recommendations and/or opinion herein, prior to making an investment decision.

You should take full responsibility of your investment decision(s) and we accept no liability whatsoever for any direct or consequential loss arising from any use of our recommendations and/or opinion provided herein or any solicitations of an offer to buy or sell any securities. Comments and opinions forwarded/provided by members/followers of this blog do not belong to the Admin and we take no responsibility of such.

Thursday, 3 December 2015

Technical Stocks To Watch on 3/12/2015 – LCTH (5092), K1 (0111), ASIAPLY (0105) & KEINHIN (7199)

Yesterday on 2/12/2015, LCTH (5092) able to close well above the resistance level of MYR0.740 after breaking the short term downtrend line as shown in the image below:
LCTH Daily Chart

Foresee LCTH should trade within a very tide range unless it can break thru the subsequent downtrend line with increased in traded volume in the next coming trading days.


K1 (0111) successfully broke out the downtrend line and closed above the MA10 with higher tha average traded volume during the session ended on 2/12/2015.
                                                                                           K1 Daily Chart

Foresee K1 would tests the both resistance level of MYR0.310 & MYR0.340 in the next trading days.

Those who intend to enter K1, a stop loss could be put @ any price below support level of MYR0.290.


ASIAPLY (0105) opened gap up during the market open on 1/12/2015 and closed higher with higher than average traded volume during the session ended.  
                                                                                      ASIAPLY Daily Chart

The gapped up caused ASIAPLY easily to break out of the downtrend line and closed with Bollinger Band opened wider during the trading session ended.

Should the historical high can be violated in the coming trading days, the sky is the limit for ASIAPLY.

One should set a stop loss at any price below MYR0.270 should this support level being violated.


KEINHIN (7199) is trading well supported by MYR0.605 but was resisted by MYR0.645 since the last 4 trading days. 
                                                                                  KEINHIN Daily Chart

However, KEINHIN able to close above the short term downtrend line during the session ended on 2/12/2015.

With a closing with shadows on 3 consecutive trading days since 27/11/2015 till 1/12/2015, foresee KEINHIN could trade higher in the coming next trading days if the accompanied traded volume is increased significantly by breaking thru the resistance level of MYR0.645.

Put a stop loss at any price below MYR0.605 should any uncertainty happen.


Lastly, few thing to take note that USD strengthened, crude oil price plunged down again & US markets also closed in red on yesterday night. So, one should take into consideration on these factors when intends to enter into the local market today.


Good luck & Happy Trading!


Disclaimer:

All posts and documents submitted in this blog are solely for open discussion and education purposes only. All recommendations and opinion provided are solely for your consideration only and you should exercise your own judgment in forming your own investment decision(s). Please also be informed that equity investment is risky and we recommend you to conduct sufficient searches for information in addition to referring our recommendations and/or opinion herein, prior to making an investment decision.

You should take full responsibility of your investment decision(s) and we accept no liability whatsoever for any direct or consequential loss arising from any use of our recommendations and/or opinion provided herein or any solicitations of an offer to buy or sell any securities. Comments and opinions forwarded/provided by members/followers of this blog do not belong to the Admin and we take no responsibility of such.

Monday, 30 November 2015

Technical Stocks To Watch on 30/11/2015 – ECS (5162), VTROX (6963), OCK (0172), SOLID (5242) & INSTACO (0069)

ECS (5162) is trading well supported by the uptrend line although ex-date for dividend of MYR0.08 on 25/11/2015 causing the price drops substantially but with only lower than average traded volume.
CS Daily Chart

With the closing price closed higher than the support level of MYR1.52 and also the short term downtrend line  in the latest 2 trading days on 26-27/11, foresee ECS should trade in the range price between MYR1.52 -MYR1.60 in the next trading days.

Should the resistance level of MYR1.60 be violated, the next resistance level to be met by ECS is @ MYR1.68.


VITROX (0097) is anticipated in trading above the support level of MYR3.25 after violated this level on 23/11/2015 after a cup and handle was formed since 10/8/2015. 
                                                                                       VITROX Daily Chart

Foresee VITROX will continue its upward trend with the next resistance level is @ MYR3.55 in the next coming trading days.


OCK’s (0172) price was being adjusted and plunged down after the ex-date for rights issue on 19/11 and closed as low as MYR0.640.  
                                                                                      OCK Daily Chart

However, the price soared up in the next trading days with increased in traded volume and closed higher @ MYR0.715 during the session ended. OCK is trading with supports of uptrend line since then.

If OCK is able to trade above the resistance level of MYR0.715, the next target for it to be met is the gap down that formed on 10/8/2015 with the subsequent target level is @ MYR0.770.


SOLID (5242) undergoes a correction after making the new high of MYR1.53 as of 24 & 25/11/2015 but it is still trading above the short term uptrend line.
                                                                                        SOLID Daily Chart

In case SOLID is trading any price within MYR1.50-1.53 in the coming trading days, breakout of the historical high of MYR1.53 shouldn’t a road block for it if the price and the traded volume increased significantly at the same time. 


INSTACO (0069) was trading in super bull run since 23/9/2015 from the super long ranging period from as low as 0.075 to as high as MYR0.34 within the 2 months period. 
                                                                                    INSTACO Daily Chart

The counter is taking a breather in the latest few trading days after a soared in trading price in a long period of time before a new trend to be started in near future.

Form the chart as shown above, INSTACO is now trading in a tide range between MYR0.305-0.34 but with higher than average traded volume in the recent trading days. 

Foresees a new bull run should take into place in case INSTACO is trading with closing price is @ or above MYR0.32 in the next coming trading days.


Look out SUPERMX as well as if the resistance of MYR2.51 is able be violated, then a bull run can be seen on this counter.


Good luck & Happy Trading!


Disclaimer:

All posts and documents submitted in this blog are solely for open discussion and education purposes only. All recommendations and opinion provided are solely for your consideration only and you should exercise your own judgment in forming your own investment decision(s). Please also be informed that equity investment is risky and we recommend you to conduct sufficient searches for information in addition to referring our recommendations and/or opinion herein, prior to making an investment decision.

You should take full responsibility of your investment decision(s) and we accept no liability whatsoever for any direct or consequential loss arising from any use of our recommendations and/or opinion provided herein or any solicitations of an offer to buy or sell any securities. Comments and opinions forwarded/provided by members/followers of this blog do not belong to the Admin and we take no responsibility of such.

Wednesday, 25 November 2015

Stocks To Watch on 26/11/2015 - DSONIC (5216)

DSONIC (5216) closed green with higher than average traded volume during the session ended while only 268 counters closed green and 669 counters closed red on 25/11.
                                                               
                                                                    DSONIC Daily Chart

DSONIC was trading above the resistance level of MYR1.59 after it broke out the downtrend line and closed above this resistance level since then on 18/11/2015.

Foresee DSONIC would trade higher in the next trading days after it closed above the recent high of MYR1.65 during the session ended.


Good luck & happy trading!


Disclaimer:

All posts and documents submitted in this blog are solely for open discussion and education purposes only. All recommendations and opinion provided are solely for your consideration only and you should exercise your own judgment in forming your own investment decision(s). Please also be informed that equity investment is risky and we recommend you to conduct sufficient searches for information in addition to referring our recommendations and/or opinion herein, prior to making an investment decision.

You should take full responsibility of your investment decision(s) and we accept no liability whatsoever for any direct or consequential loss arising from any use of our recommendations and/or opinion provided herein or any solicitations of an offer to buy or sell any securities. Comments and opinions forwarded/provided by members/followers of this blog do not belong to the Admin and we take no responsibility of such.


Friday, 20 November 2015

MAGNI-Tech

MAGNI (7087)


Magni-Tech Industries Bhd was incorporated in Malaysia on 12 March 1997 & listed on the 2nd Board of Bursa on 18 April 2000. It was subsequently transferred to the Main Board of Bursa on 8 April 2003. Tan Sri Dato’ Seri Tan Kok Ping is the Executive Chairman & Mr. Tan Poay Seng, the Managing Director. 

The Group was initially involved in packaging business, before diversifying into apparel business. On 1 November 2006, Magni completed the acquisition of the entire equity stake in South Island Garment Sdn Bhd, an established apparel manufacturer. The diversification into apparel business has reduced the Group’s reliance on the packaging business and enhanced its earnings.


Apparel Business

For the 12 Months ended 30 April 2015, the garment business accounted for 83.2% of the Group's revenue. 


The Group’s garment business is undertaken by its wholly-owned subsidiary, South Island Garment Sdn Bhd (SIG) which has its manufacturing facilities in Malaysia. SIG also operates through contract manufacturing facilities in Vietnam which are joint business collaborations with its Vietnamese partner. 

With about 40 years of experience in the apparel industry, SIG has built a good reputation in this industry and is known among its customers as a reliable and consistent manufacturer of high-quality and sophisticated woven sportswear. SIG mainly exports its products to international markets such as the USA, European Countries, South America, China, Japan, Mexico, Australia and Canada.

Packaging Business

The packaging businesses are undertaken by Magni’s 3 other subsidiaries which have manufacturing facilities in Malaysia. The packaging products are typically used by the manufacturing sector, especially the electronic as well as the food, beverage, healthcare and tobacco sub-sectors. Although the packaging products are mainly sold locally, a high percentage of them are used in the packaging of manufactured products destined for the export markets.


We monitor Magni because:-
  1.  It is currently riding on the coattails of Nike’s booming sales
  2. Stable, low cost production base in Vietnam
  3. Trans Pacific Partnership Agreement gains for “Made in Malaysia/Vietnam” clothing
  4. Bright long-term prospects in the apparels industry

Nike’s long-term growth record because of:-
  1. Plans to hit USD50bil in revenue,
  2. Well positioned to take advantage of an expanding global sports apparel industry and a stable growth of China sales even in the face of slowdown elsewhere
  3. Reporting good financial growth, consistently exceeding street views
  4. A beneficiary of the gain in popularity of athleisure trends
  5. One of the most innovative companies worldwide
  6. Ownership of a portfolio of globally recognized brands
  7. Strong marketing programmes (endorsement deals with high-profile athletes)


Magni has registered a track record of uninterrupted profits since 2007, with its performance mainly tracking Nike’s sales performance. The company delivered a 10-year revenue CAGR of 22.5% from 2005 to 2015, surviving many of the crises that impacted the world economy.


Magni has a total net cash of RM100mil, a treasury cash pile of RM0.92per share. The company has been generating healthy operating cash flows and has been in a net cash position since 2008. With this large amount of cash in hand, Magni has enough cash to fund capex for plant expansions or seek M&A opportunities.

The company has been steadily increasing DPS since 2005, even though it does not have an explicit dividend policy. Magni recently announced its final dividend of 3 per share ex-date to be set on 9th Nov 2015. With a higher earnings base going forward, we think there is still possibility the company will declare stable/higher dividends. Assuming the company kept dividend payouts above 25%, the expected dividend yield is about 2.5%.


Disclaimer:

All posts and documents submitted in this blog are solely for open discussion and education purposes only. All recommendations and opinion provided are solely for your consideration only and you should exercise your own judgment in forming your own investment decision(s). Please also be informed that equity investment is risky and we recommend you to conduct sufficient searches for information in addition to referring our recommendations and/or opinion herein, prior to making an investment decision.

You should take full responsibility of your investment decision(s) and we accept no liability whatsoever for any direct or consequential loss arising from any use of our recommendations and/or opinion provided herein or any solicitations of an offer to buy or sell any securities. Comments and opinions forwarded/provided by members/followers of this blog do not belong to the Admin and we take no responsibility of such


Technical Stocks To Watch on 20/11/2015 – GDEX (0078), EDUSPEC (0107), VS (6963), PRLEXUS (8966) & N2N (0108)

GDEX (0078) was trading in the uptrend channel since 8/9/2015 after rebounded from the downtrend from the historical high of MYR1.84 on 14/4/2015.
DEX Daily Chart

Furthermore, GDEX abled to trade higher after brokeout the recent resistance of MYR1.53 from a shorterm sideway with higher than average traded volume on 19/11.

Foresee GDEX would trade higher in the next trading days with the latest resistance to be met is @ MYR1.65. If this level is abled to break, the next target to be met is the historical high of MYR1.84. 


EDUSPEC (0107) was trading in uptrend since 26/8/2015 and one by one broke the Fibonacci Retracement level and the latest breakout is the important Fibonacci level of 61.8% or MYR0.34 with relatively increased in traded volume. 

                                                                                   EDUSPEC Daily Chart
The breakout of ascending triangle also accompanied by Bollinger Band opened wider.

Foresee EDUSPEC would trade higher in the next trading days with the target price @ 78.6% Fibo level and the subsequent historical high of MYR0.43. 


VS (6963) was trading higher high from time to time since 19/5/2015 with 2x of dividend and 1x of shares split. 
                                                                                            VS Daily Chart
Until comes to a time where the resistance of MYR1.59 turned into support since 18/11/2015 with VS price closed higher each day. 

A long shadow was seen on the candlestick on 19/11 suggesting that VS should trade new high in the next trading days with Bollinger band opened wider as well.


PRLEXUS (8966) was trading in uptrend since 27/8/2015 but was resisted by MYR2.65 on 23/10 and hovering within this level and uptrend line (ascending triangle). 
                                                                                      PRLEXUS Daily Chart

However, this resistance level was broke by PRLEXUS on 19/11 with higher than average traded volume. 

Foresee PRLEXUS would trade higher in the next trading days and in case historical high of MYR2.73 could be broke, the limit for it is the sky!


Refer to the blog written on 19/11 (http://fatta888.blogspot.my/2015/11/technical-stocks-to-watch-on-19112015.html), I mentioned take a look on N2N (0108) in the last paragraph and this really counter surging up with tremendous huge traded volume. 
                                                                                        N2N Daily Chart

Foresee N2N would trade higher after stay above the support @ MYR0.88 and will testing the historical high of MYR1.08 in the next trading days.


Good luck & Happy Trading!


Disclaimer:

All posts and documents submitted in this blog are solely for open discussion and education purposes only. All recommendations and opinion provided are solely for your consideration only and you should exercise your own judgment in forming your own investment decision(s). Please also be informed that equity investment is risky and we recommend you to conduct sufficient searches for information in addition to referring our recommendations and/or opinion herein, prior to making an investment decision.

You should take full responsibility of your investment decision(s) and we accept no liability whatsoever for any direct or consequential loss arising from any use of our recommendations and/or opinion provided herein or any solicitations of an offer to buy or sell any securities. Comments and opinions forwarded/provided by members/followers of this blog do not belong to the Admin and we take no responsibility of such.