Tuesday, 18 October 2016

Stocks To Watch on 19/10/2016 - YOCB(5159) & OWG(5260)

YOCB Daily Chart

Refer to the blog written on 13/10/2016; http://fatta888.blogspot.my/2016/10/stocks-to-watch-on-13102016-yocb-5159.html, YOCB (5159) resumes its uptrend with one long white candlestick and higher than average traded volume in the latest session indicating a very strong bullishness ahead after tested and retraced from the 50% Fibonacci Retracement level on 13/10/2016 and closed above this level after the market closed.

The recent high of MYR1.37 should be the next target for YOCB to test in the coming trading days. 


OWG Daily Chart

OWG (5260) ended with one long white candlestick with significant increased in traded volume in the latest session signaling the bull started its journey to the north.

Foresee the bullishness will continue in the coming trading days with nearest level to test is MYR2.46.


Good luck and happy trading!


Disclaimer:
All posts and documents submitted in this blog are solely for open discussion and education purposes only. All recommendations and opinion provided are solely for your consideration only and you should exercise your own judgment in forming your own investment decision(s). Please also be informed that equity investment is risky and we recommend you to conduct sufficient searches for information in addition to referring our recommendations and/or opinion herein, prior to making an investment decision.

You should take full responsibility of your investment decision(s) and we accept no liability whatsoever for any direct or consequential loss arising from any use of our recommendations and/or opinion provided herein or any solicitations of an offer to buy or sell any securities. Comments and opinions forwarded/provided by members/followers of this blog do not belong to the Admin and we take no responsibility of such.     

Sunday, 16 October 2016

Stocks To Watch on 17/10/2016 - JAKS (4723), COMFORT (2127) & UMSNGB (7227)

JAKS Daily Chart

A notable spike up in traded volume was seen in the latest session for JAKS (4723) with 1 white bar but the price was closed at MYR1.02 after resisted by both downtrend line and 50% Fibonacci Retracement level or MYR1.04.

In addition, JAKS showing its higher low is getting higher and higher (green arrows) and the last higher low is well supported by the 65-days Moving Average implying a rebound from downtrend to uptrend took place since 31/5/2016.

Should JAKS is trading breakout above both downtrend line and 50% Fibonacci Retracement level or MYR1.04  level decisively in the coming trading days, the nearest target level it would testing is the 78.6% Fibonacci Retracement level. 


COMFORT Daily Chart

COMFORT (2127) undergone a correction after reaching its recent high of MYR0.815, which is also the 50% Fibonacci Retracement level on 27/9/2016 from a rebound lowest point at MYR0.605 since 24/6/2016 after suffered a major correction or downtrend from the historical high of MYR1.00.

However, a rebound was detected and COMFORT stayed and closed above the support level of MYR0.745 (red dotted line) in the latest session with full white candlestick.

COMFORT need to trade and stayed above the essential point of MYR0.755 in the coming trading days in order for the turning from the downward correction to upward direction from the recent rebound to be successful. In doing so, a significant increased in trading volume is needed to push further COMFORT to move higher to test the 50% Fibonacci Retracement level or MYR0.850 again.


UMSNGB Daily Chart

UMSNGB (7227) closed exactly at the downtrend line at MYR1.36 with improved volume in the latest session with 1 relatively long white candlestick after making a rebound on 19/9/2016 from the correction since 24/8/2016.

Besides, UMSNGB also well supported by 50% Fibonacci Retracement level or MYR1.33 during the consolidation period umtil a  relatively long white candlestick was formed in the latest session.

In case the bull is set to breakout above the downtrend line to climb higher with significant increased in trading volume in the coming trading days, the nearest level it would be tested is the recent high of MYR1.46.


Good luck and happy trading!


Disclaimer:
All posts and documents submitted in this blog are solely for open discussion and education purposes only. All recommendations and opinion provided are solely for your consideration only and you should exercise your own judgment in forming your own investment decision(s). Please also be informed that equity investment is risky and we recommend you to conduct sufficient searches for information in addition to referring our recommendations and/or opinion herein, prior to making an investment decision.

You should take full responsibility of your investment decision(s) and we accept no liability whatsoever for any direct or consequential loss arising from any use of our recommendations and/or opinion provided herein or any solicitations of an offer to buy or sell any securities. Comments and opinions forwarded/provided by members/followers of this blog do not belong to the Admin and we take no responsibility of such.     

Thursday, 13 October 2016

Stocks To Watch on 13/10/2016 - YOCB (5159), KERJAYA (7161) & SKPRES (7155)

YOCB Daily Chart

YOCB (5159) has undergone a consolidation phase for a period of time end of Aug 2016 with very little volume traded. 

However, a notable increased in trading volume with a full bar was detected in the latest session with closing price at MYR1.17.

Should the bull start the engine in the coming trading days, YOCB would move higher with target prices to meet are the Fibonacci Retracement level as drawn.


KERJAYA Daily Chart

KERJAYA (7161) undergoes a correction period after making the historical high of on 26/7/2016, however it was well supported by the 65-days Moving Average (indicated by arrows), where the latest price was closed just nice above the MA65 during the session ended although it was traded below this line before that.

If the MA65 is supports effectively, foresee KERJAYA would try to break above the downtrend line and heading to test the resistance level of MYR2.42 and the historical high level of MYR2.53.


SKPRES Daily Chart

SKPRES (7155) reached the Fibonacci Extension level of 150% and retreated from this level on 21/9/2016 making a correction until the latest session where a full bar was seen and closed above the middle Bollinger Band (10-days Moving Average) although the traded volume is not obvious increased.

If the bullish momentum starts in the coming trading days, moving towards MYR1.38 is the nearest target SKPRES would to test decisively.


Good luck and happy trading!


Disclaimer:
All posts and documents submitted in this blog are solely for open discussion and education purposes only. All recommendations and opinion provided are solely for your consideration only and you should exercise your own judgment in forming your own investment decision(s). Please also be informed that equity investment is risky and we recommend you to conduct sufficient searches for information in addition to referring our recommendations and/or opinion herein, prior to making an investment decision.

You should take full responsibility of your investment decision(s) and we accept no liability whatsoever for any direct or consequential loss arising from any use of our recommendations and/or opinion provided herein or any solicitations of an offer to buy or sell any securities. Comments and opinions forwarded/provided by members/followers of this blog do not belong to the Admin and we take no responsibility of such.     
  

Tuesday, 11 October 2016

Stocks To Watch on 11/10/2016 - BRIGHT (9938), PMBTECH (7172) & VS (6963)

BRIGHT Daily Chart (9938)

BRIGHT (9938) broke out above the strong resistance of MYR0.375 with huge increased in traded volume in the latest session.

Foresee BRIGHT will climb higher to test the next resistance of MYR0.450.


PMBTECH Daily Chart

Refer back to the blog written on 6/10/2016 (http://fatta888.blogspot.my/2016/10/stocks-to-watch-on-06102016-pmbtech.html), PMBTECH (7172) might continue its uptrend in the coming trading days after a minor correction tested the 50% Fibonacci Retracement level or MYR1.48 and PMBTECH makes a rebound from that level in the latest session.  

PMBTECH should test its recent high of MYR1.66 should the rebound is successful in the coming sessions.


VS Daily Chart

VS (6963) made a broke out above the triangle pattern on 29/9/2016 with notable spike up in trading volume and closed with a long white candlestick after the session.

In addition, VS once tried to break above the 50% Fibonacci Retracement level or MYR1.41 with higher price touched to MYR1.42 but closed below that level during the latest session ended. 

Should the bullish momentum coming for VS, it would test the recent high of MYR1.49.

Good luck and happy trading!


Disclaimer:
All posts and documents submitted in this blog are solely for open discussion and education purposes only. All recommendations and opinion provided are solely for your consideration only and you should exercise your own judgment in forming your own investment decision(s). Please also be informed that equity investment is risky and we recommend you to conduct sufficient searches for information in addition to referring our recommendations and/or opinion herein, prior to making an investment decision.

You should take full responsibility of your investment decision(s) and we accept no liability whatsoever for any direct or consequential loss arising from any use of our recommendations and/or opinion provided herein or any solicitations of an offer to buy or sell any securities. Comments and opinions forwarded/provided by members/followers of this blog do not belong to the Admin and we take no responsibility of such.     

Sunday, 9 October 2016

Stocks To Watch on 10/10/2016 - HOMERIZ (5160) & FLBHD (5197)

HOMERIZ Daily Chart

HOMERIZ (5160) closed with 1 good bar with 1 good volume in the latest session with Bollinger Band (BB) opened wider and middle BB, which is also the 10-days Moving Average turning upwards and HOMERIZ also broke above and closed above the 65-days Moving Average line (light blue solid line) indicating HOMERIZ may trend higher in medium term.

Another strong signal that HOEMRIZ might move higher in the medium term; at least, is the strong support at MYR0.86 which was formed since 29/3/2016, where this level never even being broke down since then implying HOMERIZ should trade any price above this level in the future.

If what anticipated is correct, the next target HOMERIZ would testing is MYR0.925 and MYR1.01.


 FLBHD Daily Chart

FLBHD (5197) suffered a strong bearishness after made the historical high of MYR3.09 since 11/01/2016 and the downfall was halted at Fibonacci Extension level of 150% or MYR1.47, where a correction happened since then.

An uptrend was spotted in this correction period where higher high and higher low (uptrend line of the triangle pattern) were formed implying a rebound from downtrend might take place in and this rebound will confirm if the price of FLBHD breaks above the downtrend line of the triangle pattern in the coming trading days as a full bar with higher than average traded volume in the latest session indicating a ignition to boost the price moving higher might take place soon as the recent low is the 2nd higher low of the correction.

MYR1.79 should be the level where FLBHD to chase for if the uptrend was confirmed after broke out above the triangle pattern in near future.


Good luck and happy trading!


Disclaimer:
All posts and documents submitted in this blog are solely for open discussion and education purposes only. All recommendations and opinion provided are solely for your consideration only and you should exercise your own judgment in forming your own investment decision(s). Please also be informed that equity investment is risky and we recommend you to conduct sufficient searches for information in addition to referring our recommendations and/or opinion herein, prior to making an investment decision.

You should take full responsibility of your investment decision(s) and we accept no liability whatsoever for any direct or consequential loss arising from any use of our recommendations and/or opinion provided herein or any solicitations of an offer to buy or sell any securities. Comments and opinions forwarded/provided by members/followers of this blog do not belong to the Admin and we take no responsibility of such.   


Thursday, 6 October 2016

Stocks To Watch on 06/10/2016 - PMBTECH (7172) & HEVEA (5095)

PMBTECH Daily Chart

PMBTECH (7172) made a major correction after tested the high of MYR1.66 since 03/08/2016 and this correction was stop after supported by 50% Fibo level of MYR1.29 on 26/09/2016.

Bollinger Band (BB) opened wider with middle BB, which is also the 10-days Moving Average is turning heading upwards indicating some degree of bullishness is started. In addition, PMBTECH closed with full bar in the latest session signaling a strong uptrend might take place in the coming trading days.

Should PMBTECH able to climb higher as anticipated, the next level it would testing is the recent high of MYR1.66.


HEVEA Daily Chart

HEVEA (5095) closed with relatively long white candle with improved volume and closed exactly at the resistance level of MYR1.27 in the latest session. However, the middle BB (10-days Moving Average) is flat in tandem with the upper and lower BB (dash lines) indicating no clear direction for HEVEA at the moment.

Keep trace on this counter and in case HEVEA is able to trade above MYR1.27 with notable increased in trading volume, foresee the BB will open wider with middle BB turning upward and it should testing the next resistance at MYR1.34 and MYR1.51.

Good luck and happy trading!


Disclaimer:
All posts and documents submitted in this blog are solely for open discussion and education purposes only. All recommendations and opinion provided are solely for your consideration only and you should exercise your own judgment in forming your own investment decision(s). Please also be informed that equity investment is risky and we recommend you to conduct sufficient searches for information in addition to referring our recommendations and/or opinion herein, prior to making an investment decision.

You should take full responsibility of your investment decision(s) and we accept no liability whatsoever for any direct or consequential loss arising from any use of our recommendations and/or opinion provided herein or any solicitations of an offer to buy or sell any securities. Comments and opinions forwarded/provided by members/followers of this blog do not belong to the Admin and we take no responsibility of such.   

Thursday, 29 September 2016

Stocks To Watch on 29/9/2016 - GCB (5102)

GCB Daily Chart

GCB opened gap up with Bollinger Band (BB) opened wider and higher than average traded volume after nearly 2 hours after the session starts today. In addition, middle BB line, which is also the 10-days Moving Average is heading upwards indicating the bull should lead GCB goes higher ahead.

The 65-days Moving Average (solid blue line) becomes the support for GCB since 25/8/2016, where it was hovering within this line created a consolidation or ranging phase whereby the bull stands firm on this support level with no panic selling in this period after a big correction since 15/1/2016.

Should the bull successfully leads GCB to climb higher in the coming trading days, the next target it would be heading is the resistance level at MYR1.09. 


Good luck and happy trading!


Disclaimer:
All posts and documents submitted in this blog are solely for open discussion and education purposes only. All recommendations and opinion provided are solely for your consideration only and you should exercise your own judgment in forming your own investment decision(s). Please also be informed that equity investment is risky and we recommend you to conduct sufficient searches for information in addition to referring our recommendations and/or opinion herein, prior to making an investment decision.

You should take full responsibility of your investment decision(s) and we accept no liability whatsoever for any direct or consequential loss arising from any use of our recommendations and/or opinion provided herein or any solicitations of an offer to buy or sell any securities. Comments and opinions forwarded/provided by members/followers of this blog do not belong to the Admin and we take no responsibility of such.   

Wednesday, 28 September 2016

Stocks To Watch on 28/9/2016 - OCNCASH (0049)

OCNCASH Weekly Chart

It was obvious that OCNCASH (0049) had broken above the downtrend line since 9/9/2016 with notable increased in traded volume and above the average traded volume during that single week period.

Besides, middle Bollinger Band, which is also the 10-weeks Moving Average line heading upward indicating some degree of strength in this counter in the weeks ahead.

Foresee OCNCASH will climb higher in near future with the nearest target price it could test is MYR0.435. 


Good luck and happy trading!


Disclaimer:
All posts and documents submitted in this blog are solely for open discussion and education purposes only. All recommendations and opinion provided are solely for your consideration only and you should exercise your own judgment in forming your own investment decision(s). Please also be informed that equity investment is risky and we recommend you to conduct sufficient searches for information in addition to referring our recommendations and/or opinion herein, prior to making an investment decision.

You should take full responsibility of your investment decision(s) and we accept no liability whatsoever for any direct or consequential loss arising from any use of our recommendations and/or opinion provided herein or any solicitations of an offer to buy or sell any securities. Comments and opinions forwarded/provided by members/followers of this blog do not belong to the Admin and we take no responsibility of such.   


Friday, 5 August 2016

Stocks To Watch on 5/8/2016 - MYCRON (5087) & WONG (7050)

MYCRON Daily Chart

MYCRON (5087) made a 1 good full bar with 1 good volume in the latest session and this stock was traded above the triangle pattern since 2/8/2016.

In addition, the highlighted oval shape is the previous consolidation phase since end of March provides a very strong support for MYCRON as this can be proved by the recent movement of this stock where the lower price for each day was getting higher and higher.  

However, the next target levels, in which the Fibonacci Retracement levels of 50% and 61.8% are the levels that MYCRON need to break thru in order for the bull to gaining momentum to push the price move higher.


WONG Daily Chart

WONG (7050) made a decisive breakout of strong resistance of MYR0.610 in the latest session with higher than average traded with supported of uptrend line.

Foresee WONG will climb higher to test the MYR0.65 level.


Good luck and happy trading!


Disclaimer:
All posts and documents submitted in this blog are solely for open discussion and education purposes only. All recommendations and opinion provided are solely for your consideration only and you should exercise your own judgment in forming your own investment decision(s). Please also be informed that equity investment is risky and we recommend you to conduct sufficient searches for information in addition to referring our recommendations and/or opinion herein, prior to making an investment decision.

You should take full responsibility of your investment decision(s) and we accept no liability whatsoever for any direct or consequential loss arising from any use of our recommendations and/or opinion provided herein or any solicitations of an offer to buy or sell any securities. Comments and opinions forwarded/provided by members/followers of this blog do not belong to the Admin and we take no responsibility of such.   

Thursday, 4 August 2016

Stock To Watch on 4/8/2016 - CHINHIN (5273) & JAYCORP (7152)

CHINHIN Daily Chart

CHINHIN (5273) made a successful breakout of the downtrend line in the latest session with closed above the Fibonacci Retracement level of 50%, indicating some degree of strength for the bull to push the price higher in the next trading days.

However, the price was retreated after tested the 61.8% of Fibonacci Retracement level, which is equivalent to MYR0.850 and closed at MYR0.845.

In case this level is broken above decisively with notable increased in traded volume, foresee a strong bull will lead CHINHIN to test the historical high of MYR0.895.


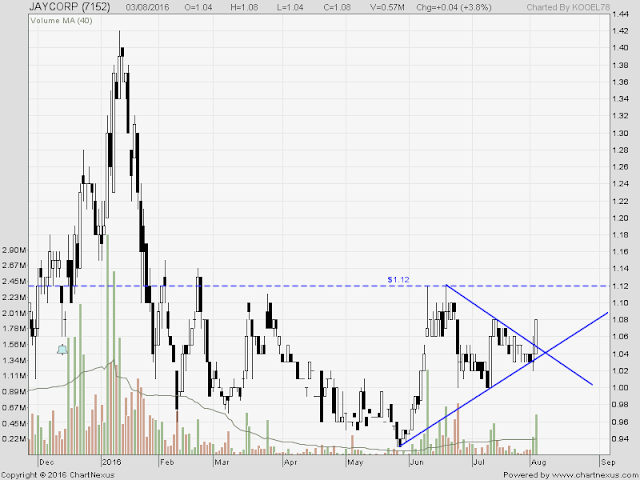
JAYCORP Daily Chart

JAYCORP (7152) made a successful breakout of downtrend line of the triangle pattern with notable spike up in traded volume in the latest session.

The next target for JAYCORP to test is the strong resistance of MYR1.12 and if this level can be broken above decisively, a strong bull should leads JAYCORP to fly higher.

Good luck and happy trading!


Disclaimer:
All posts and documents submitted in this blog are solely for open discussion and education purposes only. All recommendations and opinion provided are solely for your consideration only and you should exercise your own judgment in forming your own investment decision(s). Please also be informed that equity investment is risky and we recommend you to conduct sufficient searches for information in addition to referring our recommendations and/or opinion herein, prior to making an investment decision.

You should take full responsibility of your investment decision(s) and we accept no liability whatsoever for any direct or consequential loss arising from any use of our recommendations and/or opinion provided herein or any solicitations of an offer to buy or sell any securities. Comments and opinions forwarded/provided by members/followers of this blog do not belong to the Admin and we take no responsibility of such.   

Wednesday, 3 August 2016

Stock To Watch Today - PPHB (8273) & HOMERIZ (5160)

PPHB Daily Chart 

PPHB (8273) opened gap up during the latest opening session and closed higher with full bar with accompanied by higher than average traded volume. This gap formed became the strong support for PPHB indicating a possible strong bullish ahead. 

Strong resistance of MYR1.00 is the next target that PPHB is going to test and foresee this resistance can be broken above if the market sentiment is bullish.


HOMERIZ Daily Chart

HOMERIZ (5160) eventually made a successful breakout from the consolidation range in the latest session as it tried to make a breakout on 20/7/2016 but failed to do so.

Because 1 good bar with 1 good volume was seen in the latest session, foresee HOMERIZ will testing the next resistance of MYR1.01.

Good luck and happy trading!


Disclaimer:
All posts and documents submitted in this blog are solely for open discussion and education purposes only. All recommendations and opinion provided are solely for your consideration only and you should exercise your own judgment in forming your own investment decision(s). Please also be informed that equity investment is risky and we recommend you to conduct sufficient searches for information in addition to referring our recommendations and/or opinion herein, prior to making an investment decision.

You should take full responsibility of your investment decision(s) and we accept no liability whatsoever for any direct or consequential loss arising from any use of our recommendations and/or opinion provided herein or any solicitations of an offer to buy or sell any securities. Comments and opinions forwarded/provided by members/followers of this blog do not belong to the Admin and we take no responsibility of such.  

Tuesday, 2 August 2016

Stocks to Watch on 2/8/2016 - CHEEWAH (9423)

CHEEWAH Daily Chart

CHEEWAH (9423) successfully broke above the consolidate range since 9/6/2016; which was ranging for more than a month with improved volume in the latest session.

If CHEEWAH is able to stay and trades above the support of MYR1.22, the next target it would be tested of is the resistance at MYR1.42.

Good luck and happy trading!


Disclaimer:
All posts and documents submitted in this blog are solely for open discussion and education purposes only. All recommendations and opinion provided are solely for your consideration only and you should exercise your own judgment in forming your own investment decision(s). Please also be informed that equity investment is risky and we recommend you to conduct sufficient searches for information in addition to referring our recommendations and/or opinion herein, prior to making an investment decision.

You should take full responsibility of your investment decision(s) and we accept no liability whatsoever for any direct or consequential loss arising from any use of our recommendations and/or opinion provided herein or any solicitations of an offer to buy or sell any securities. Comments and opinions forwarded/provided by members/followers of this blog do not belong to the Admin and we take no responsibility of such. 

Monday, 1 August 2016

Stocks To Watch - CHINWEL (5007)

CHINWEL Daily Chart

CHINWEL (5007) made a breakout above the strong resistance of MYR1.46 with improved volume in the latest trading session. 

In addition, ABC trading method proven the breakout as well and foresee the downtrend line should be able to penetrate thru above by CHINWEL in the next trading days.

Good luck and happy trading!


Disclaimer:
All posts and documents submitted in this blog are solely for open discussion and education purposes only. All recommendations and opinion provided are solely for your consideration only and you should exercise your own judgment in forming your own investment decision(s). Please also be informed that equity investment is risky and we recommend you to conduct sufficient searches for information in addition to referring our recommendations and/or opinion herein, prior to making an investment decision.

You should take full responsibility of your investment decision(s) and we accept no liability whatsoever for any direct or consequential loss arising from any use of our recommendations and/or opinion provided herein or any solicitations of an offer to buy or sell any securities. Comments and opinions forwarded/provided by members/followers of this blog do not belong to the Admin and we take no responsibility of such. 

Wednesday, 20 July 2016

Stocks To Watch on 20/7/2016 - TEKSENG (7200) & SUPERMX (7106)

TEKSENG Daily Chart

Strong resistance of MYR1.29 was broke decisively and closed above this level in the latest session by TEKSENG (7200) with huge increased in traded volume.

The next target for TEKSENG to look for is the historical high of MYR1.43.


SUPERMX Daily Chart

SUPERMX (7106) seems reluctant to touch the strong support at MYR1.93 in the recent trading session indicating a consolidation phase is taking place and might seek to change movement direction from bear to bull.

Should changing of direction takes place, the next targets for SUPERMX to test is at MYR2.19 and the gap formed on 30/05/2016, which is MYR2.67.


**Can take a look on export counters like SUPERMX, LIIHEN, CHINWEL, etc as US dollar strengthened back.


Good luck and happy trading!


Disclaimer:
All posts and documents submitted in this blog are solely for open discussion and education purposes only. All recommendations and opinion provided are solely for your consideration only and you should exercise your own judgment in forming your own investment decision(s). Please also be informed that equity investment is risky and we recommend you to conduct sufficient searches for information in addition to referring our recommendations and/or opinion herein, prior to making an investment decision.

You should take full responsibility of your investment decision(s) and we accept no liability whatsoever for any direct or consequential loss arising from any use of our recommendations and/or opinion provided herein or any solicitations of an offer to buy or sell any securities. Comments and opinions forwarded/provided by members/followers of this blog do not belong to the Admin and we take no responsibility of such. 

Friday, 15 July 2016

Technical Stocks To Watch on 15/7/2016 - LKL (0182) & JAYCORP (7152)


LKL Daily Chart

From the labelled chart showed above, LKL (0182) is making a possible W-shape if the 50% or MYR0.295-0.300 of Fibonacci Retracement level can be broken decisively with notable increased in trading volume and stay above this level in the coming trading days. In addition, Bollinger band started to open wider indicating a possible rebound from bearish to bullish might take place soon.

 JAYCORP Daily Chart

JAYCORP (7152) able to close above the triangle pattern in the latest session with significant increased in traded volume. 
Foresee JAYCORP would be trading above the triangle in the next trading days.

Good luck and happy trading!


Disclaimer:
All posts and documents submitted in this blog are solely for open discussion and education purposes only. All recommendations and opinion provided are solely for your consideration only and you should exercise your own judgment in forming your own investment decision(s). Please also be informed that equity investment is risky and we recommend you to conduct sufficient searches for information in addition to referring our recommendations and/or opinion herein, prior to making an investment decision.

You should take full responsibility of your investment decision(s) and we accept no liability whatsoever for any direct or consequential loss arising from any use of our recommendations and/or opinion provided herein or any solicitations of an offer to buy or sell any securities. Comments and opinions forwarded/provided by members/followers of this blog do not belong to the Admin and we take no responsibility of such.   

Thursday, 16 June 2016

冷眼先生-交流记

冷眼先生-交流记

今天很有幸的,能与冷眼先生有个交流会。就在此和大家分享吧。
一直以来有99%的人都会问他对市场的看法。这让冷眼先生很不解,为什么大家都不是问他对公司的看法呢。投资本来就应该关心公司的营运和前景,而不是市场。他对目前市场走势也不了解。

投资模式有很多。无论什么数据和计价证明,只要你不能从股市赚钱,一切都是空谈。投资本来是件很简单的东西,但很多人却把他复杂化。只要你能从生意的角度去看价值,市场的行情走势和股价对你不会有影响。

以AirAsia为例子,他说如果给你选AAX和AirAsia,你会选哪个?其实这答案很简单。冷眼先生说如果想起国内航班或便宜班机,你会想起什么航线?如果想起国际航班,你又会想起什么航线?这答案顿时点醒了我! AirAsia最新季度扣除了外汇收入大概在每股10-15cent左右。至于它的价值呢,他说这要看看市场到底会给AirAsia什么PE。

谈起债务,冷眼先生也对此有另一番见解。以他过往的经验,债务并不是最重要的一环。就算一个公司债务再高,只要那公司能持续带来positive营运现金流,这代表公司营运没什么问题,也能解决债务的负担。只要那公司业务能持续增长,债务也只是个数字。Cash Flow和Profit才是一门生意的王道。这番答案不得不让我对冷眼先生的生意眼光和见解,感到佩服!

此外,冷眼先生也对NTA有不同的看法。NTA是一间公司的净资产,他是不属于股东的。就算cash和asset再多,只要公司不好好利用来增加收益,也与股东无关。当然,一间又高现金又有好业绩的公司,更是最好不过。所以呢,NTA不是他选支股票的考量。

总结来说,冷眼先生选股精髓就在以下。这已经排除了NTA。
G – Growth 成长
D – Dividend 股息
P – Price (PER) 价值
P – Profit 盈利
R – ROE 股东回酬
C – Cash Flow 营运现金流

最后,冷眼先生说市场有80-90%的人是没能赚钱的,有时不是因为选错股,而是缺少了真确的心态和定力!这点只有靠你自己磨练才能领悟。所以呢,他鼓励投资者不停地看书增加知识。活到老,学到老。

附上冷眼先生的名言!“复杂的事简单做,简单的事正确做,正确的事常常做。”

希望我的分享能帮助更多投资者减少撞板!这次的交流真的获益不浅,也很期待冷眼先生未来将推出的新书。


Note: Sharing from other source

Friday, 10 June 2016

Stock To Watch on 10/6/2016 - JOHOTIN (7167)

JOHOTIN Daily Chart

Currently, JOHOTIN is trading within the triangle pattern for quite sometime since the big fall since 24/11/2015 and a U-turn of trend from downtrend to uptrend took place after the bleeding was stop. 

Take a closer look on this counter should the breakout of the the upper downtrend line of the triangle patter really take place, foresee a bull run will lead the trend towards the resistance of MYR2.23.

Good luck and happy trading!


Disclaimer:
All posts and documents submitted in this blog are solely for open discussion and education purposes only. All recommendations and opinion provided are solely for your consideration only and you should exercise your own judgment in forming your own investment decision(s). Please also be informed that equity investment is risky and we recommend you to conduct sufficient searches for information in addition to referring our recommendations and/or opinion herein, prior to making an investment decision.

You should take full responsibility of your investment decision(s) and we accept no liability whatsoever for any direct or consequential loss arising from any use of our recommendations and/or opinion provided herein or any solicitations of an offer to buy or sell any securities. Comments and opinions forwarded/provided by members/followers of this blog do not belong to the Admin and we take no responsibility of such.